____ _ | __ )| | ___ __ _ | _ \| |/ _ \ / _` | | |_) | | (_) | (_| | |____/|_|\___/ \__, | |___/_ _ _/_| |__ ___ _ __| |_ _ _/_ / _ \ '_ \ / _ \ '__| | | | |/ _ \ __/ |_) | __/ | | | |_| | __/ \___|_.__/ \___|_| |_|\__,_|\___|
[2026-02-15][Daily]
Really really nice results, showed exactly what I was thinking concerning relation between avg cpu usage and energy consumption. Sometimes we can run for almost the same runtime, but at lower cpu% so consumption is lower. Really encouraging!
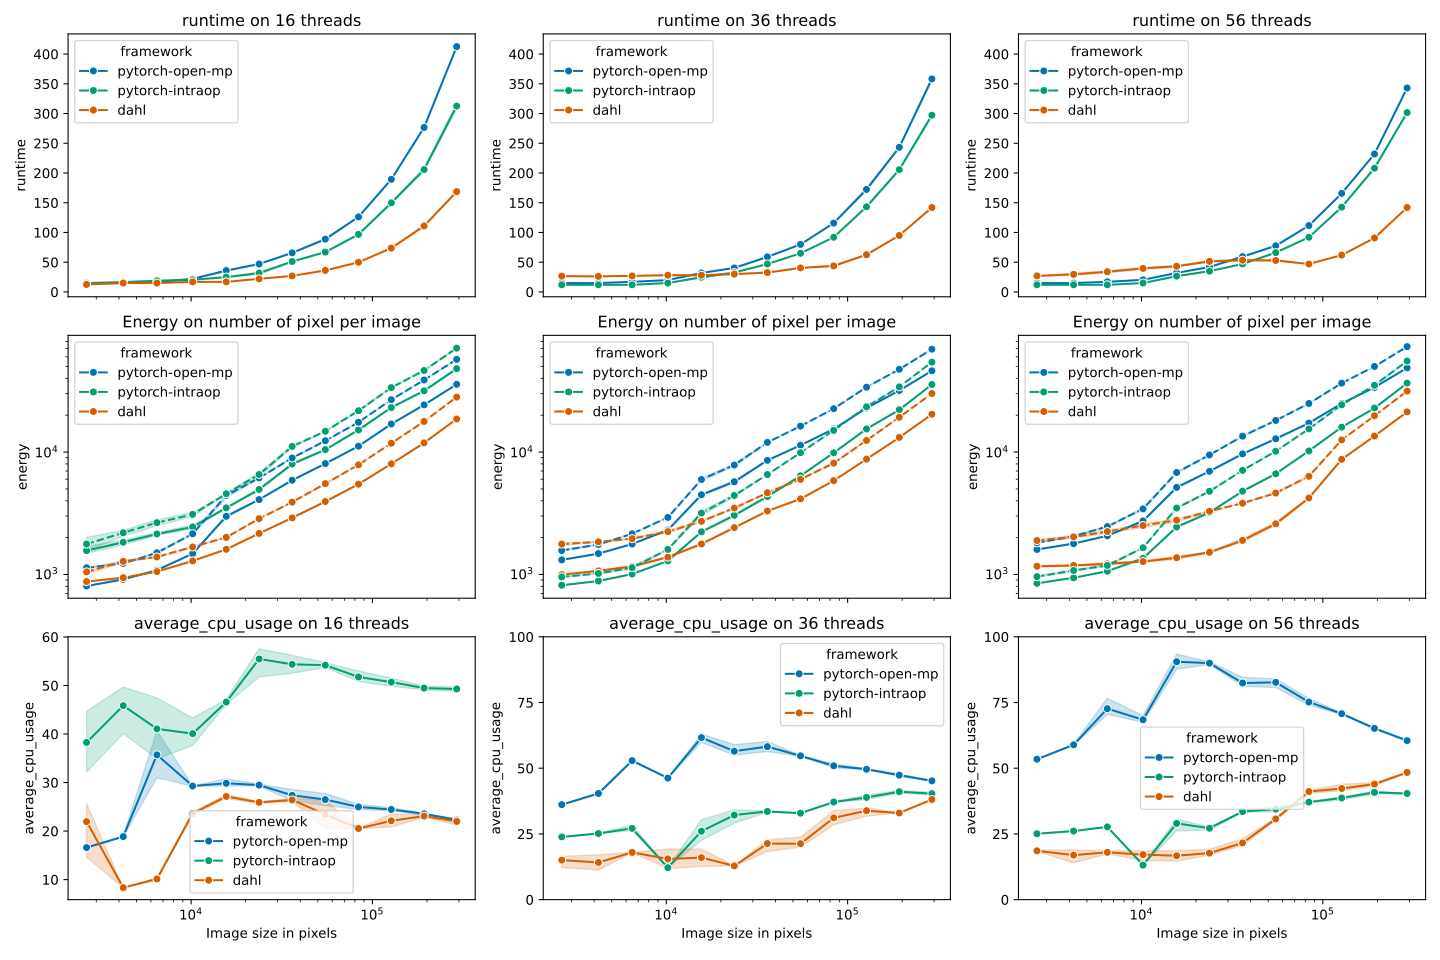
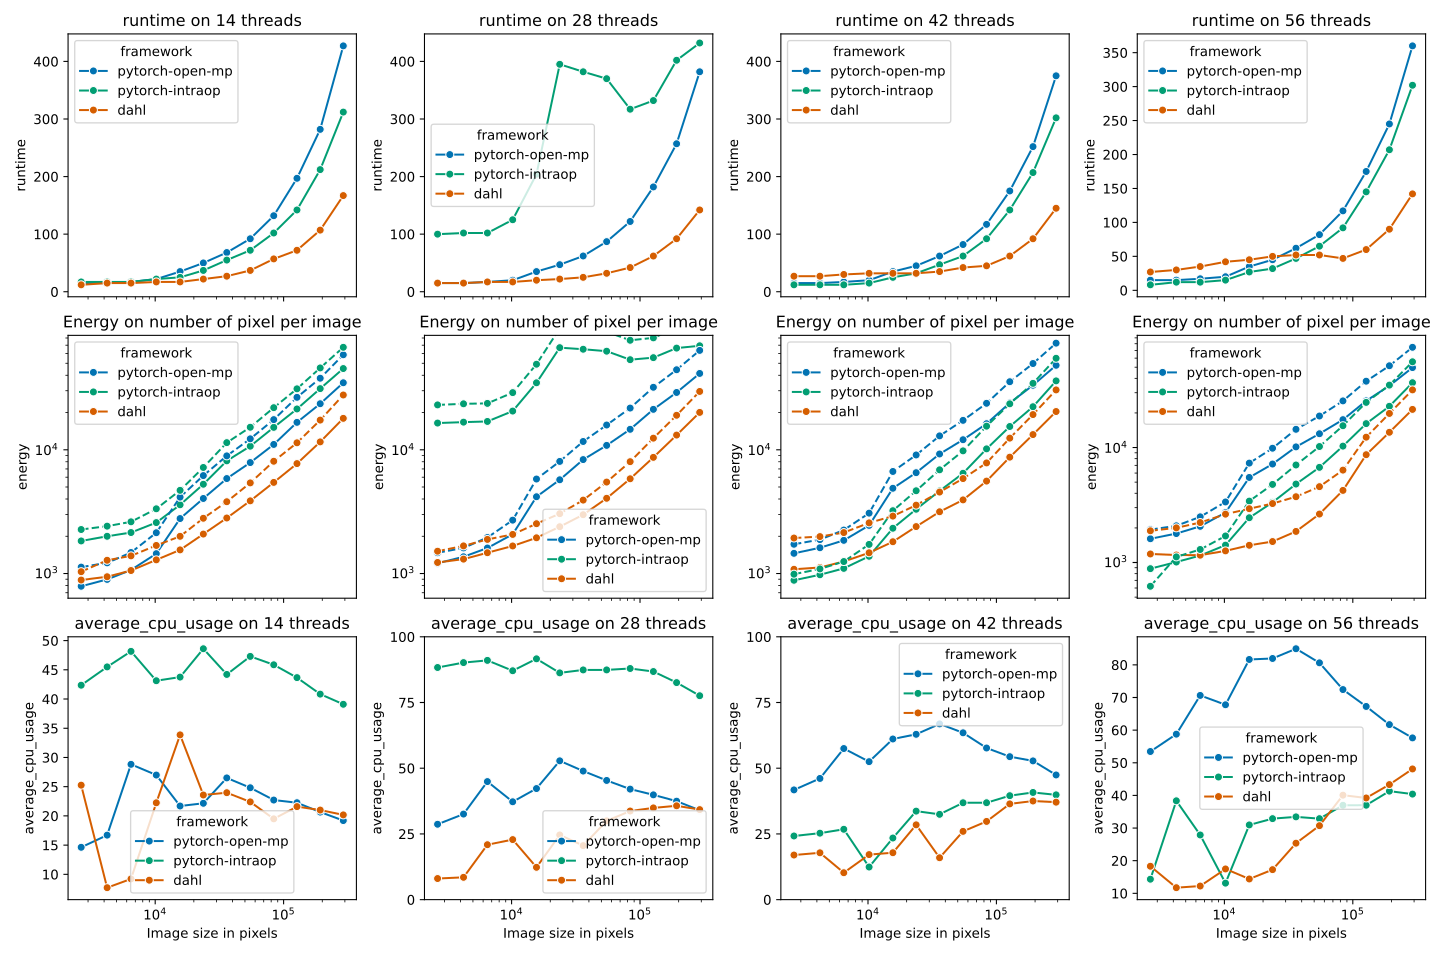
Here I did not do confidence intervals to speed up experiment process, next step is to reproduce with CI. Also improved plots: it makes more sense to allign metrics together from left-to-right, and align common xps from top-to-bottom. It permits comparing actual values of metrics, e.g. energy consumption way more easily. And comparing energy with runtime for the same xp stays easy.
Plotted on 3x3 so its more readable, and it keeps every information we want to highlight. The results are coherent from what we've seen since the beginning, and doing the workload experiments on 3 different threads number add really nice context on energy saving! Indeed, if we can run on lower %cpu usage, energy can be saved. Moreover, using 16 threads on small workloads is actually better in terms of runtime! Increasing the number of threads implies better runtime only on bigger workloads. Dahl is usually better because even though it is not always faster, its avg cpu% is more often lower and scales more "naturally".