 ____  _
| __ )| | ___   __ _
|  _ \| |/ _ \ / _` |
| |_) | | (_) | (_| |
|____/|_|\___/ \__, |
               |___/
     _               _
 _/_| |__   ___ _ __| |_   _  _/_
/ _ \ '_ \ / _ \ '__| | | | |/ _ \
  __/ |_) |  __/ |  | | |_| |  __/
\___|_.__/ \___|_|  |_|\__,_|\___|
< Previous post
|
Next post >
[2026-02-20][Recap]
commit: 9271bd95ab66f8a472a6a4ef181a463b2b2c133d
Parameters:
- Datasets: Fashion-MNIST
- CIFAR-10
- big-fashion 270x360x3
- Batch size: 1-256
- Num cores: 28
- Num samples: 8192
- Num epochs: 5
- Runs for CI: 5
- Cores: 28
- Using all cores
As seen on the figure in the introduction, energy consumption during the epochs is linear. In our
experiments we noticed that 5 epochs was sufficient to produce meaningful results. Observations:
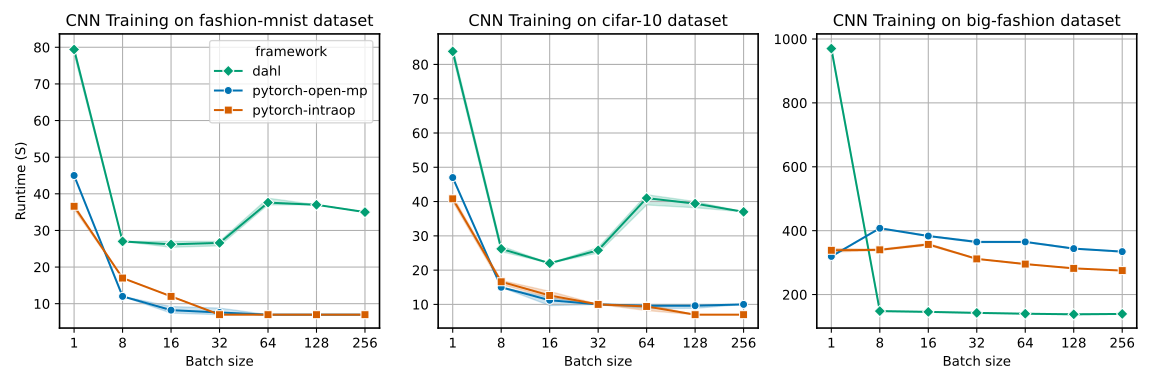
- Increasing batch size helps reducing runtime for every of the dataset and framework used.
This makes a lot of sense because increasing batch size decreases data dependency, which helps
parallelizing more.
- On CIFAR and Fashion-MNIST, pytorch solutions shows better runtime whatever the batch size. But
on big fashion, dahl outperforms pytorch as soon as it uses batching.
Dahl implements batch parallelism which explains the sudden jump between 1 and 8. However stating
why dahl is better is harder, but could be exlpained thanks to task granularity and using a TGCS.
- On Big-fashion, pytorch solutions don't gain much runtime from increasing the batch size.
This could show that for this kind of images, pytorch solutions struggles to gain more
throughput.
Parameters:
- Datasets: Big-fashion [26x34x3 - 270x360x3]
- Batch size: 32 (here we chose 32 because of results of the previous experiment).
- Num cores: [8
- 18
- 28]
- Num samples: 8192
- Num epochs: 5
- Runs for CI: 5
Observations:
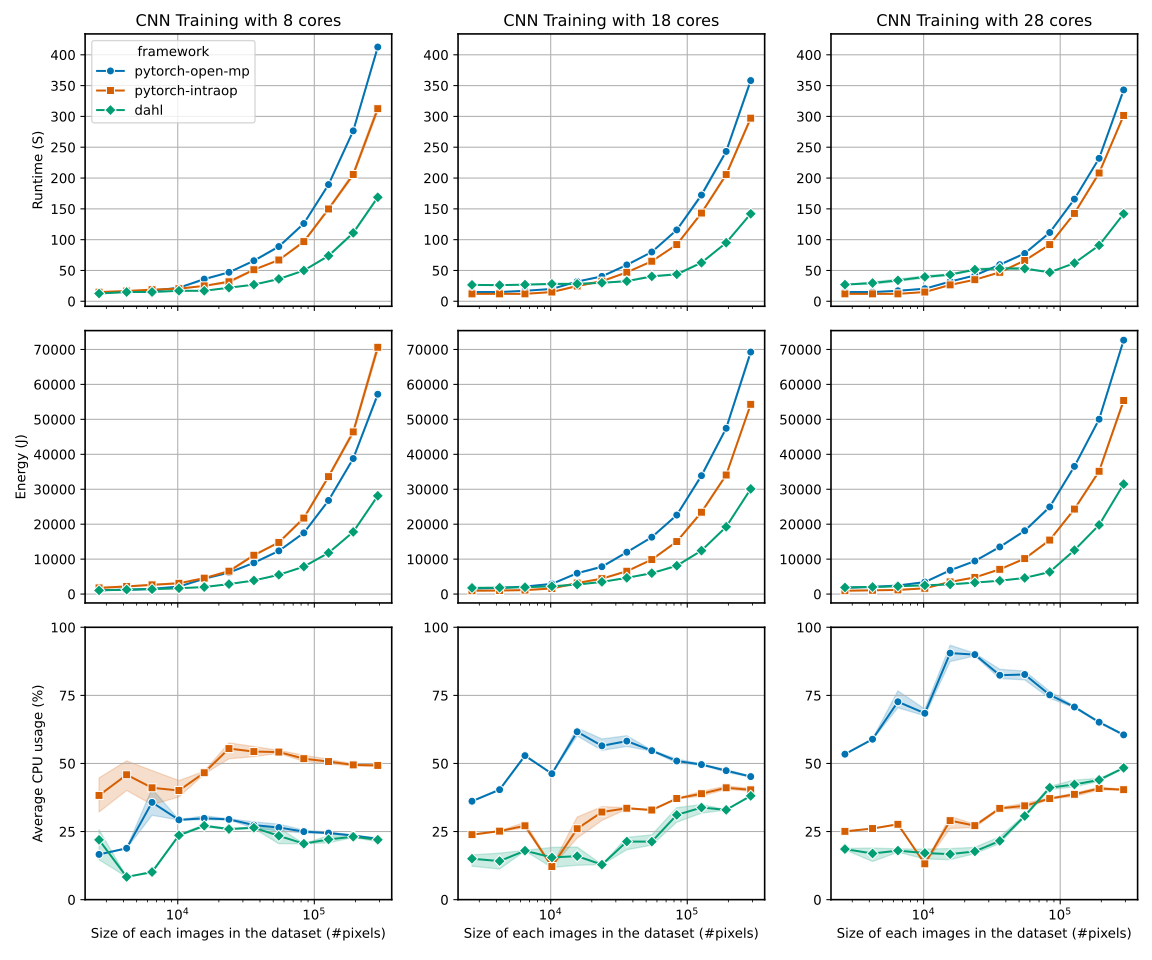
- For OpenMP, giving more cores for the training will result in: decrease in runtime, increase of
AVG cpu% and energy consumption.
- For Pytorch-intraop however, we notice smaller gains in runtime, but much greater improvements in
energy consumption. Also, AVG cpu usage is lower.
- We notice a comparable behavior on DAHL, at the exception that AVG cpu usage remains comparable
and that lower-sized-datasets do take more time to train than on pytorch solutions.
- Now comparing open-mp and intraop, we notice that even though pytorch-open-mp runs longer on 8
cores, it still has a lower energy consumption and cpu usage. This tendency is completly reversed
at 18 and 28, as open-mp drastrically augments CPU usage and energy consumption, while intraop is
doing the opposite.
When using 8 cores, or 18 cores, the other cores are not used, yet they are not deactivated
either. For pytorch-intraop, we can only control the number of threads invoked by pytorch. As our
machine is compatible with hyper-threading (here 2 thread per core), we decided to use two times
more the amount of cores allocated for the other frameworks. So here for 8 cores we use 16 threads,
18 to 36, 28 to 56.
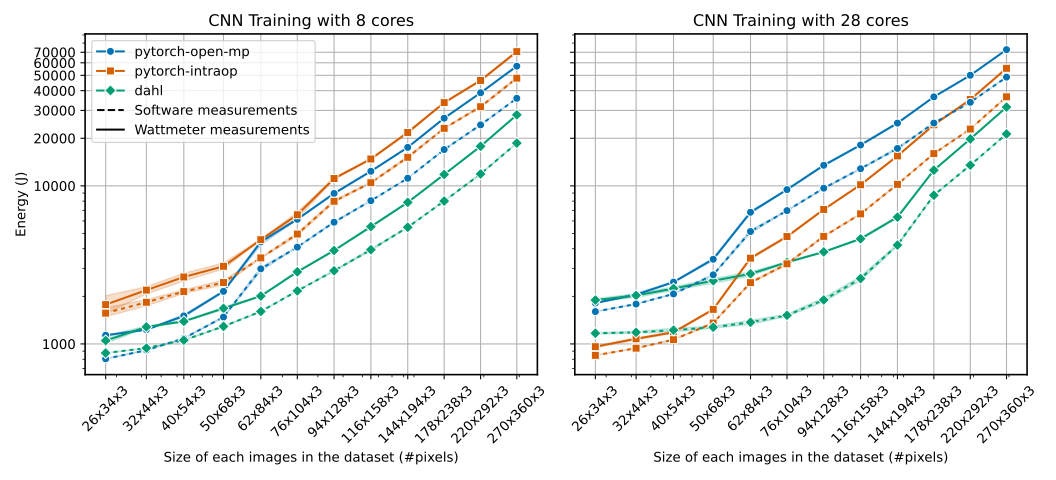
Two options, either we show only 28 cores, or we show 8 and 28.
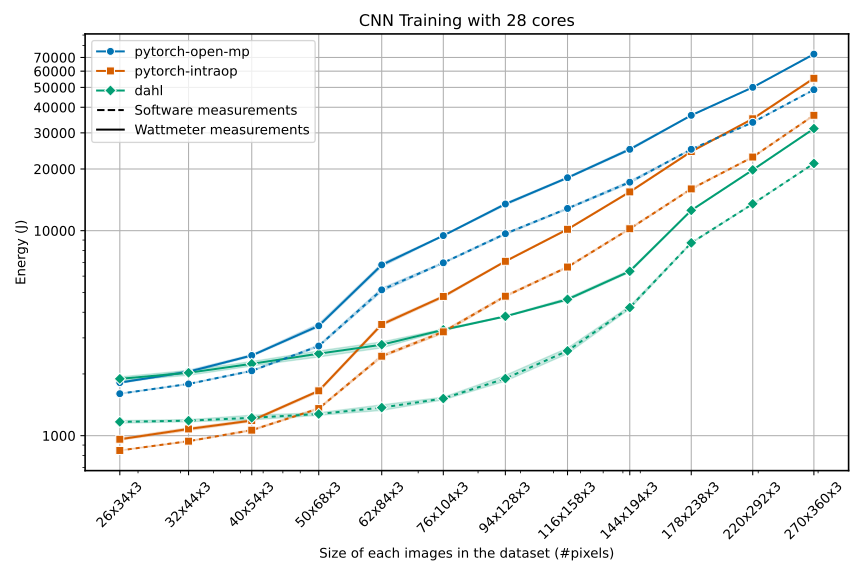
Observations:
- On both 8 and 28 cores, dahl and open-mp starts equivalent in terms of energy consumption, but
dahl scales better on bigger datasets, which is the opposite for open-mp and occurs using images
at 62x84x3.
- Intraop has the worse energy consumption on 8 cores and is pretty steady, whereas when using all
cores, it has the best energy consumption but suffers from the same jump at 62x84x3.
- DAHL does not suffer from this jump as it appears to happen later at 178x238x3.
StarPU reports the following numbers on the smallest dataset:
- 28 cores: executing 1.75%, callback 1.81%, waiting 0.09%,
sleeping 89.02%, scheduling: 0.08%, overhead 7.24%.
- 8 cores: executing 7.55%, callback 3.06%, waiting 0.33%,
sleeping 79.39%, scheduling 0.28%, overhead 9.40%.
- 1 core: executing 33.79%, callback 23.64%, waiting 1.11%,
sleeping 0.26%, scheduling 1.49%, overhead 39.72%.
And on the biggest dataset:
- 28 cores: executing 58.54%, callback 1.02%, waiting 2.43%,
sleeping 35.07%, scheduling 0.05%, overhead 2.89%.
- 8 cores: executing 84.39%, callback 1.17%, waiting 0.75%,
sleeping 10.94%, scheduling 0.10%, overhead 2.65%.
- 1 core: executing 96.32%, callback 0.98%, waiting 0.15%,
sleeping 0.91%, scheduling 0.09%, overhead 1.55%.
< Previous post
|
Next post >