____ _ | __ )| | ___ __ _ | _ \| |/ _ \ / _` | | |_) | | (_) | (_| | |____/|_|\___/ \__, | |___/_ _ _/_| |__ ___ _ __| |_ _ _/_ / _ \ '_ \ / _ \ '__| | | | |/ _ \ __/ |_) | __/ | | | |_| | __/ \___|_.__/ \___|_| |_|\__,_|\___|
[2026-01-24][Daily]
Fixed avg cpu metric and energy consumption with the wattmeter:
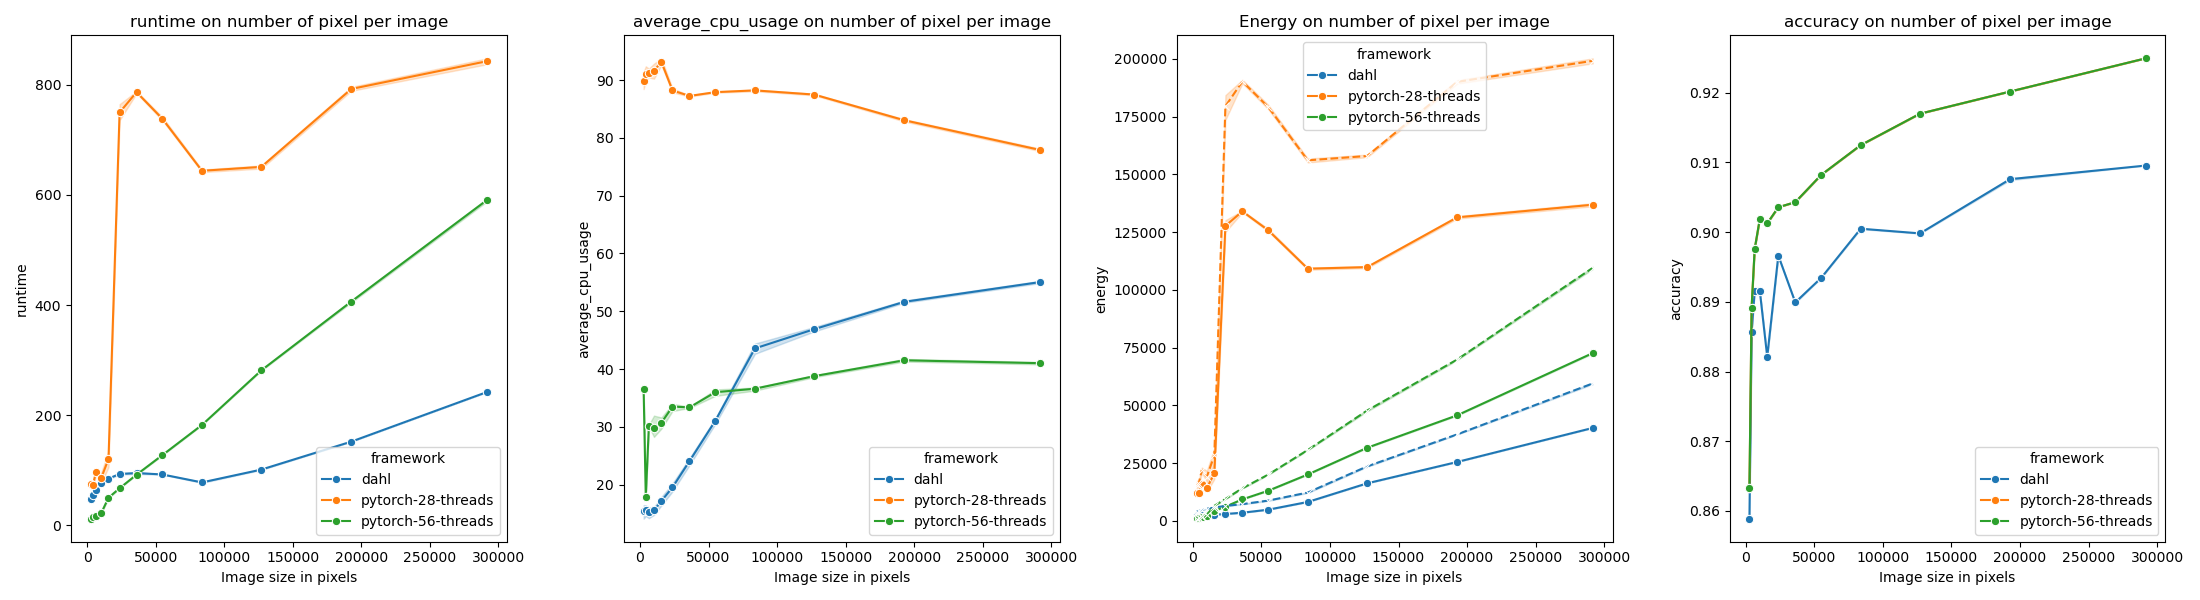
Here dashed lines on energy plot indicate wattmeter measurements, while solid lines indicate RAPL measurements.
Following previous experiments, comparing dahl vs pytorch 56 threads + 4 dataloaders, this time with 10 epochs to have more accurate results. Pretty great results, indeed, we notice that wattmeter energy is higher than software measured one, which was to be expected. We have really great confidence intervals.
Note that here I used 5 seconds polling interval on the wattmeter, which was a mistake: at first I wanted to use 1sc to match alumet. I'm not sure it would have changed a lot, but we might use 1 sc in future experiments, I just hope it won't "overload" the plug, as it is supposed to be 30sc minimum, my solution is more of a hack to poll more.
Seems like starpu really adapts CPU load and is able to scale correctly while maintaining low energy consumption. This is not the case for pytorch.
Comparing 28 vs 56 thread: 28 = high avg cpu, but longer runtime, very interesting!